(IC2) Area Under the Graph#
By the end of the lesson you will be able to:
Use definite integrals and geometric formulas to calculate the net area between a curve and the \(x\)-axis.
Use definite integrals and geometric formulas to calculate the total area between a curve and the \(x\)-axis.
Lecture Videos#
Region Under a Graph#
The phrase area under the curve refers to the area of the region which is:
bounded above by the graph of \(y=f(x)\).
bounded below by the \(x\)-axis.
bounded on the left by the vertical line \(x=a\).
bounded on the right by the vertical line \(x=b\)
For this interpretation, we need function \(f\) to be:
continuous on the closed interval \([a,b]\)
nonnegative on the closed interval \([a,b]\)
Calculate Area
Let \(f\) be a continuous, nonnegative function on the interval \([a,b]\). The area under the graph of \(f\) from \(a\) to \(b\) is given by:
Note that this formula only applies if \(f\) is nonnegative (graph never goes below the \(x\)-axis).
Example 1#
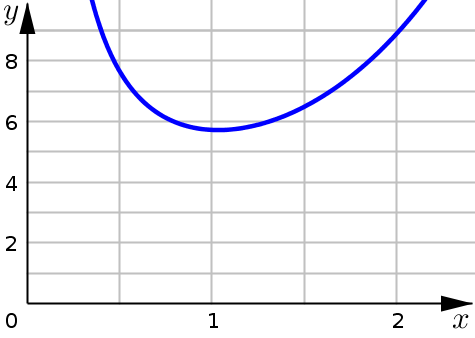
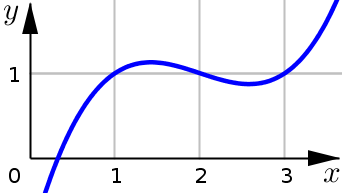
Compute the area under the given curve
We note that this function is continuous and nonnegative on the closed interval \([1,2]\). Even though the function has a discontinuity at \(x=0\), this is okay since that location is not inside the interval.
Since the function satisfies both necessary conditions, we can set up our area calculation:
Calculating the area of this region, then becomes a problem of calculating the definite integral:
Example 2#
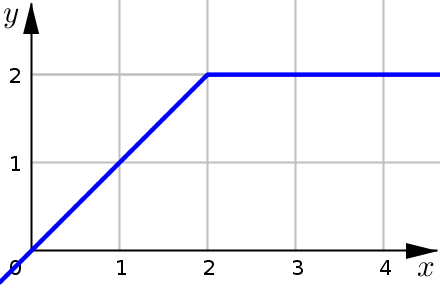
Find the area under the graph of \(f\) from \(a\) to \(b\) where
We note that this function is continuous and nonnegative on the closed interval \([0,4]\). Even though the function is negative for \(x<0\), this is okay since those locations are not inside the interval.
Since the function satisfies both necessary conditions, we can set up our area calculation:
The main difficulty with integrating a piecewise function (like we have) is that the function behaves differently over different sections of the \(x\)-axis.
For this problem, we see that the function splits at \(x=2\):
Over the interval \(x\leq 2\), our function is \(f(x)=x\)
Over the interval \(x>2\), it is \(f(x)=2\)
So how do we use apparently two different formulas in our integration?
We split up the integral! Since the different pieces of our function split at \(x=2\), we split up the integration there as well.
For the first integral, we are looking at the interval from \(0\) to \(2\), which satisfies: \(x\leq 2\). This means we are going to use the \(f(x)=x\) piece for this integral.
For the second integral, we have the interval from \(2\) to \(4\), which satisfies \(x\geq 2\). This means we are going to use the \(f(x)=2\) piece for this integral. (Note that since \(f\) is continuous, we don’t have an issue here with the equal sign.)
This gives us:
Now we just need to calculate each of these definite integrals individually.
Notice that you could also use a little Geometry to calculate this area instead:
Area of Triangle
From \(0\) to \(2\), our region is a right triangle, which we can calculate the area for using:
Area of Rectangle
From \(2\) to \(4\), our region is a rectangle (actually a square), which we can calculate the area for using:
Put it together
And then putting these two areas together we get:
Area and the Definite Integral#
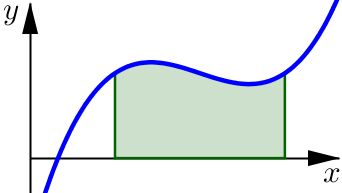
In this graph we see that the region is on or above the \(x\)-axis.
In this case the definite integral represents the area of the shaded region (as we’ve already discussed):
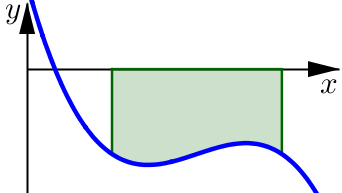
In this graph we see that the region is on or below the \(x\)-axis.
In this case the definite integral represents the negative of the area of the shaded region:
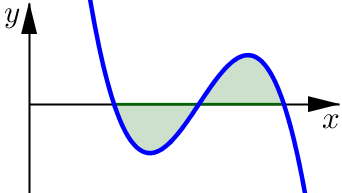
In this graph we see that the region is partially above and partially below the \(x\)-axis.
In this case the definite integral represents the area of the section that lies above the \(x\)-axis minus the area of the section that is below:
Net Area#
As these graphs illustrate, we now have a way to interpret the definite integral of continuous functions, without the nonnegativity condition. We call this net area.
Net Area
Let \(f\) be a continuous function on the interval \([a,b]\).
The Net Area gives us a way to measure how much of our region sits above the \(x\)-axis compared to how much is below:
Positive: If the region above has a larger area than the region below, then the definite integral will be positive.
Negative: If the region above has a smaller area than the region below, then the definite integral will be negative.
Zero: If the region above and the region below are perfectly balanced (have the same area), then the definite integral will be \(0\).
Total Area#
While the net area over an interval can be helpful, sometimes we are also interested in finding the total area of the region between a curve and the \(x\)-axis. What is the difference between these two values?

Net Area is a comparison, there’s a direction component to the value. It represents how much of the region sits above the \(x\)-axis compared to how much is below.
Total Area represents the area of the shaded region, without accounting for whether a specific region is above or below the \(x\)-axis. We’re just finding the area of the shaded region. Essentially, we’ve removed the direction component.
Since the total area is the area of the geometric region, it can only be positive (or possibly \(0\) if the region has zero width).
As we’ve seen though, net area can be positive (if a majority of the region is above), negative (majority of the region is below), or zero (if the regions above and below are completely balanced).
Example 3#
Consider the function \(f(x)=x^2-x\) on the interval \([0,2]\).
Find the total area of the region between the curve and the \(x\)-axis on this interval.
Find the net area on this interval.
Total Area Strategy: Since the integral formula for total area involves absolute value (which is a piecewise function), we are going to need to split up the integration based on where the function is positive and negative.
Find the \(x\)-values where \(f\) intersects the \(x\)-axis.
Determine the intervals where \(f\) is above / below the \(x\)-axis.
Calculate the area over each interval.
Add the results
Essentially, we are going to do calculations to find the area of the region that sits above the \(x\)-axis and then separately, the area of the region that sits below. Once we have the area of each distinct region we add the results together to get the total area.
To find the distinct regions, we essentially need to do a sign chart for \(f\).
Determine where \(f(x)=0\) (where the graph intersects the \(x\)-axis)
Find the sign of \(f\) on each of the resulting intervals. This will tell us if the region is above or below the \(x\)-axis on that subinterval.
Intersection Points
We start by setting \(f(x)=0\) and solving for \(x\).
Sign Chart
These \(x\)-values we just found, \(x=0\) and \(x=1\), split up the interval \([0,2]\) into separate subintervals: \((0,1)\) and \((1,2]\).
We use these intervals to help create the sign chart for \(f\). In the first column we put the factors of \(f\) and in the first row we list the intervals and then we fill in the sign chart accordingly:
Note that we could also come to this conclusion by looking at the graph of the function (but using a sign chart is helpful if we don’t have the graph).
On the interval \((0,1)\) the graph is below the \(x\)-axis.
On the interval \((1,2]\) the graph is above the \(x\)-axis.
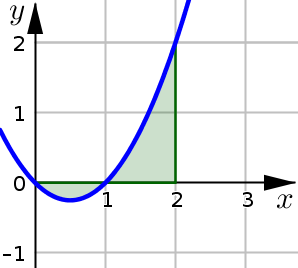
To find the area of the region that sits above the \(x\)-axis, we simply integrate the function over the interval \([1,2]\) (since it is nonnegative on this interval).
To find the area of the region that sits below the \(x\)-axis, we are going to integrate the function over the interval \([0,1]\). But since the graph is below the \(x\)-axis here, we will need to negate our result in order to get the area.
Notice that since the function is negative on the interval \([0,1]\), when we calculate the definite integral over this interval we are getting a negative result.
In this case the negative can be thought of as a direction: it’s telling us that the region is indeed below the \(x\)-axis. So to then get the area for this region we just use the magnitude (or negation of the integral):
To find the total area then, we use:
Since we’ve already found the area of each individual region, we can then find the net area using:
Note that you could check this directly by just calculating the definite integral over the entire interval \([0,2]\).
Example 4#
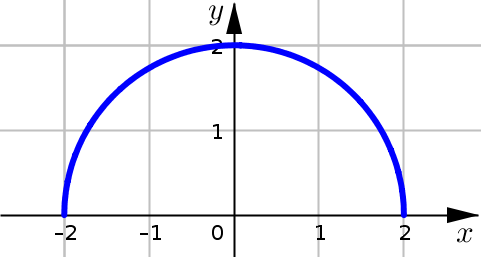
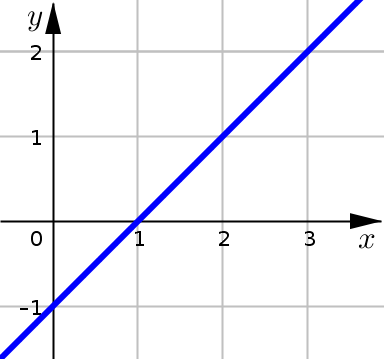
Evaluate the following integrals by interpreting each in terms of area:
\(\displaystyle \int_0^2 \sqrt{4-x^2} \; dx\)
\(\displaystyle \int_0^3 \big(x-1\big) \; dx\)
Properties of Definite Integrals#
For a continuous function \(f\) on closed interval \([a,b]\) we had previously looked at two properties of the definite integral that are probably best interpreted in terms of area:
Zero Width
Splitting the Integral
Symmetric Functions#
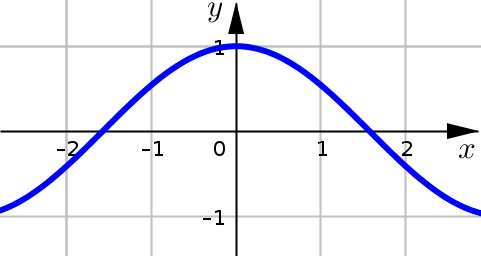
Odd / Even Functions
Suppose \(f\) is continuous on the interval \([-a,a]\).
Even Functions If \(f\) is even (\(f(-x)=f(x)\) for all \(x\)) then:
Odd Functions If \(f\) is odd (\(f(-x)=-f(x)\) for all \(x\)) then:

